本教程快速教如何使用Prometheus检测网站并进行可视化
仅教使用方法,不涉及原理
部署于Linux机器,需要安装的有docker
首先,利用Github上的快速部署脚本,(需要联网)
https://github.com/skilladd/skills_tools/releases/tag/v0.1.1
下载完skills_tool.sh脚本,执行,选择 4 ——> 1
就会安装容器镜像,工作目录为脚本所在目录的/prometheus-stack,可移动

进入http://206.119.51.36:3000 ,ip为你的主机ip,这里显示错误,不要用给的,而且docker ps 可看到信息
进入网页后,默认admin:admin凭据
调中文,右上角头像——>profile——>向下拉看到Language调整
然后设置数据源,选择Prometheus
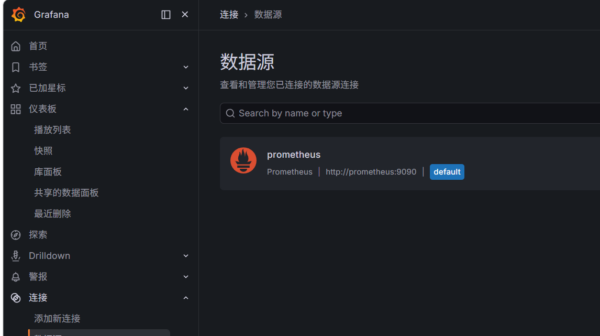
然后进入左边菜单 仪表板 处,点击新建——>导入

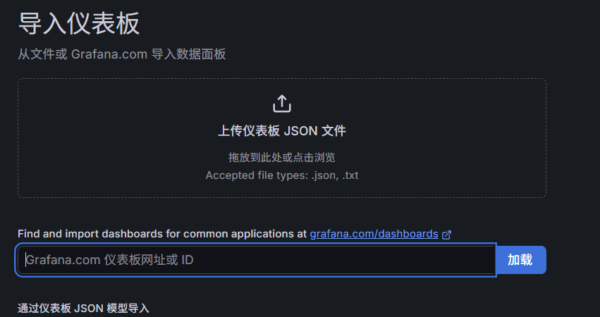
此处填入找到的可视化界面模板
https://grafana.com/grafana/dashboards/
这个链接可以找模板,找到后填入url即可,例如
https://grafana.com/grafana/dashboards/1860-node-exporter-full/
就导入了1860-node-exporter-full这个模板
导入模板后,接下来设置显示数据
编辑prometheus目录下的websites.yml文件(/opt/Prometheus是我的目录)
root@master:/opt/Prometheus/prometheus-stack/prometheus/targets# ls -la
total 16
drwxrwxr-x 2 sanopll sanopll 4096 10月 5 14:18 .
drwxrwxr-x 3 sanopll sanopll 4096 10月 5 12:15 ..
-rw-rw-r-- 1 sanopll sanopll 152 10月 5 12:19 nodes.yml
-rw-rw-r-- 1 sanopll sanopll 216 10月 5 14:18 websites.yml
编辑websites.yml,自行设置(这是我的配置,上面的targets是默认的,可以删去)
- targets:
    - https://www.google.com
    - https://www.github.com
    - http://my-internal-app.local
  labels:
    service: 'public-api'

- targets:
    - https://sanopll.top
  labels:
    service: 'blog-sanopll'
编辑后,使用命令 curl -X POST http://localhost:9090/-/reload 加载配置
回到网页中 仪表板——>新建——>导入
输入13659,然后加载
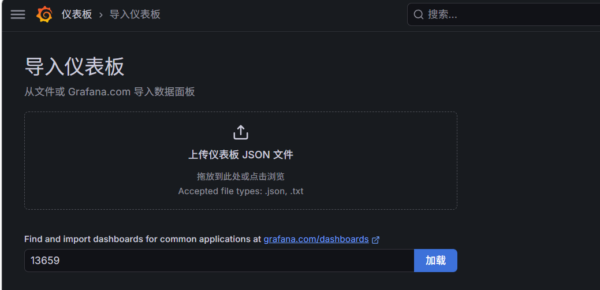
数据源选择Prometheus

接着点击编辑——>设置——>变量,可按我的配置来(看图)
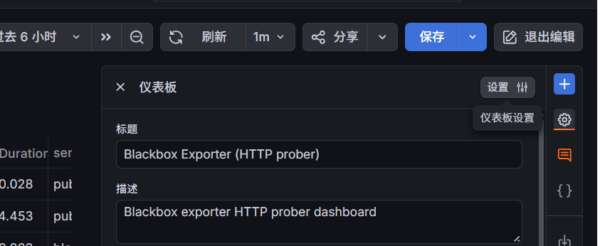
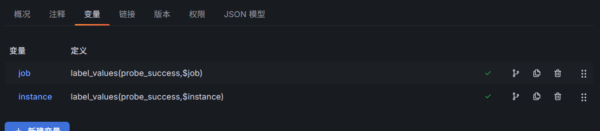
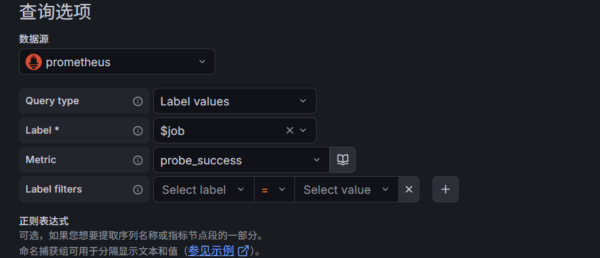
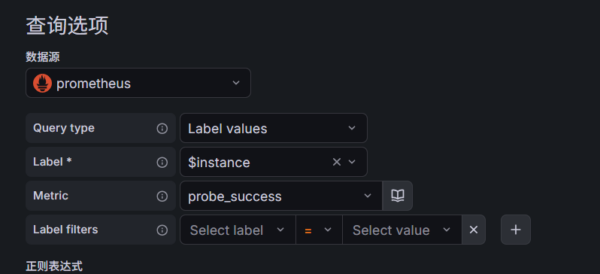
保存即可,并备注(可写更改信息)
接着刷新即可,刷不出来等一会,就显示了
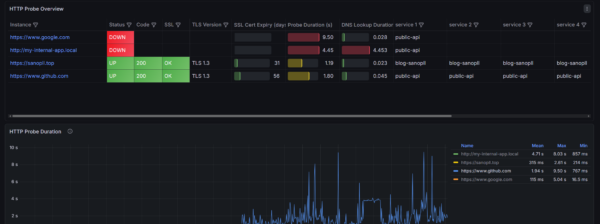
- THE END -

最后修改:2026年10月5日
非特殊说明,本博所有文章均为博主原创。




共有 0 条评论